"The opinions expressed here are my own personal views and will be used in a paper to fulfill requirements of University of Toronto Management of Big Data Analytics Certification"
Community Activism in the age of Big Data
Open Data and the city of Toronto.
Toronto joined a host of other Canadian and international cities that is posting data related to the city for the public on the
Toronto Open Data Portal, This is becoming an increasingly important topic just look at the following news in the past few months alone :
So the city has started encouraging third parties to use its openly published data, most notable example is the TTC busses and trains data that is currently used multiple mobile Apps.
Further more the city encouraged the community to get involved, and this is going to be the topic of my next few blogs and paper.
We the people.
Imagine if you will, a community that wants to reduce speed limits in their streets or maybe is concerned about the size of a mega condo unit being planned or the presence of a new mega store at the heart of their area.
Any of these and other events could have a big effect on the quality of life in the neighbourhood, and the big business behind a project will come armed with 'paid' expert opinions and studies to support their case.
The goal of this work and my hypothesis is that we can use open data (traffic, licenses, accidents, weather, etc.) to give voice to the voiceless, to help those who need help by providing them with the data that supports their well being, the availability of such data will also isolate the rational and emotional resistance and/or support for many decisions, paving the road to a smooth process of community engagement in many projects.
The anticipated users will be
- Community organizers
- Campaigners (Political, Social)
- Individuals
- Local small business owners
- School boards
- Local event boards
- ..
Challenges for Open Data Providers
Government open data does face a lot of challenges from regulations to considerations of safety and privacy, etc. but the municipal level of government can have some specific challenges.
- Limited resources (compared to Provincial and Federal levels of government).
- Heightened privacy concerns, as the small size of the data set could expose personal information, specially in municipalities with small population (so maybe more in Georgetown or Woodstock compared to Toronto or London).
- The need to not just make more data available but to budget and acquire new sets of data.
Civic Engagement effect on Government Open Data
The topic of big data is moving from the hype stage slowly into main stream, Public Data still in and on itself deserves a closer look at some of its attributes.
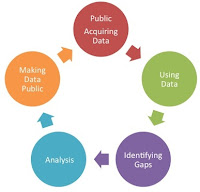
One of the most intriguing attributes of public data is that so far the type, quality and size of data available is a bottom up/ inside out process, where the city decides what data maybe useful to the public and takes input from the technical startup community.
Once the public starts using the data a new channel of feedback will start to flow with requests focusing on :
- Quality
- Field expansion.
- Data integrity issues.
- ..
- Availability
- Missing data.
- New Data acquisition (I just realized that the pedestrian/traffic data is collected at an intersection once a year ?! ).
- Context
- As the public starts using data, New contexts will appear as a result of mixing data sets (Can we graph Federal interest rates, household debt and number of new business licenses issued ? ).
- Those results could pose a challenge as they may require some co-ordination between different levels of governments.
- Some of those contexts may pose threats to privacy, security and/or regulation so constant revision maybe needed.
In response to those challenges the city may need to partner with tech providers and private sector and the local tech community to provide ideas on how to fill the gaps and provide the best data assets to the public.
Data Activism !
So now we have the data, but how does one provide this data in a way to help the community there are generally two types of approaches and .. well a hybrid third option.
- Ad-Hoc approach.
- In this approach the data is acquired and searched for a specific topic
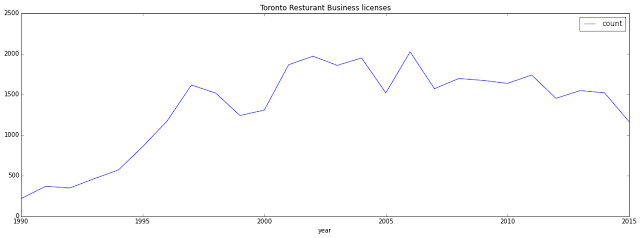
- In the next post of this series I will use this approach to study new business licenses in Toronto in a certain neighbourhood, finding out how many business opened in the area through the years. which could be used to prove the effect of certain events on a neighbourhood business quality.
- This approach is perfect for certain small targeted issues, such as zoning, speed limits, or even city councillor level campaigning.
- This graph shows the number of restaurant licenses issued from 1990 to date and is built using IPython notebook , Pandas and matplotlib.
- General public Service approach.
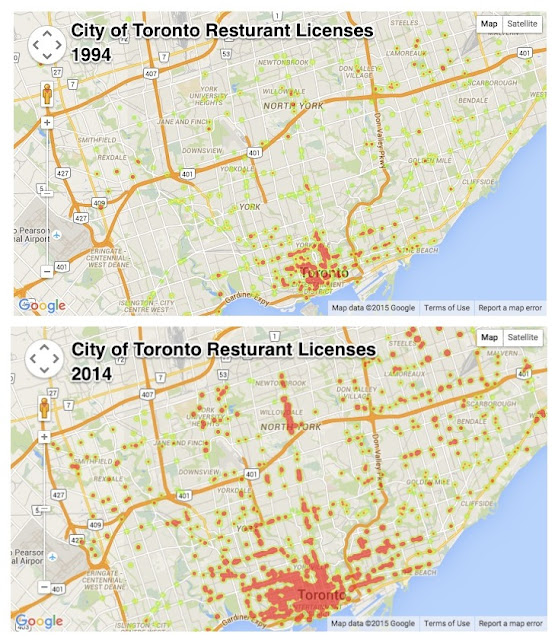
- In this approach the data is collected en-masse and is manipulated and hosted and made available for the public.
- For the example above, the data will be provided on a web interface where the user can see a heat-map of the city and the business licenses opened at a certain year or have the option to pick a neighbourhood and choose range of years to search the number of business licenses.
- A variant of that is the TTC apps currently available by 3rd party vendors using TTC data from the city Toronto (although in this case the data is collected at run-time and on request).
- This type of undertaking is large and unless the site providing it has some revenue stream from future traffic this type of application is generally hard to be done on volunteer bases.
- Hybrid.
- In this approach the developers will pick certain sets of data that they are interested in and provide them with a certain level of customization available to the user.
- So for example you can provide data about accidents reports and allow the user to choose their data set on a map.
- A great example of this is the wonderful work at http://censusmapper.ca/, They are probably the original 'Data Activists' on the federal level, providing some of the data to any consumer who wishes to view it on a federal level as a way to highlight the importance of the full-form census.

Conclusion
Big Data Analytics is becoming an essential tool for decision making in every business and level of government, it is about time this power is handed to the public in the most suitable way, from community to federal, from schools to political campaigning, Open Data mixed with new technologies and a little bit of community give-back will reshape the face of civic engagement and community campaigning in the future.
Coming Soon to a notebook near you !
A detailed Blog on using IPython notebooks to analyze some City of Toronto new licensing data.


 Another file we will need is a file that contains all Canadian Postal Codes and their Latitude and Longitude (I contemplated using google maps API's but the sheer number of Postal code calls made me realize I will run my 2400 calls per day quota in no time).


