New Resturant licenses by number in the city of Toronto for 2014.
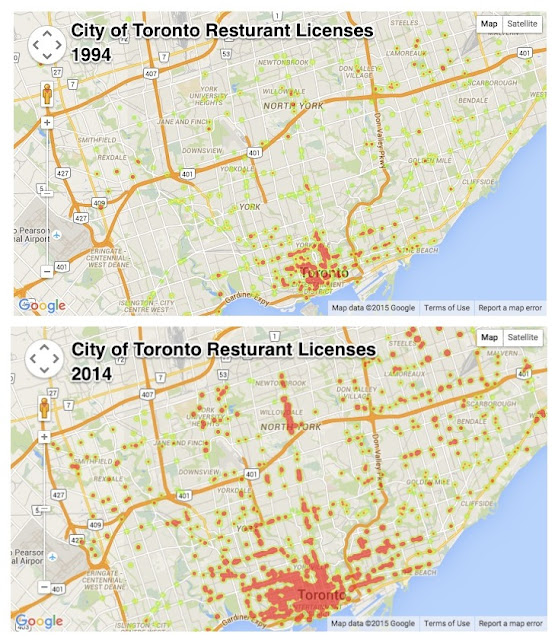
So, someone came with a request asking us to show a heat map of restaurants licenses granted in the city of Toronto in 2014 to compare it with 2015 (maybe to see the effect of certain urban changes on restaurants opening )
Why restaurants ?, I think they do represent quite a good indicator of extra spending and the health of the economy of certain areas. just look at the difference between 1994 when the city issued 569 licenses to 2014 where the number shot up to 1519

So in this post we will discuss the steps I went through to transfer the CSV data available from the city into a heat map of city licenses in the city.


Downloading the Code
The Code is available on GitHub
Data Acquisition
OK This is the easiest part, just go to the City of Toronto Portal and you can easily Acquire the file which is called 'Business Licenses.csv'
 Another file we will need is a file that contains all Canadian Postal Codes and their Latitude and Longitude (I contemplated using google maps API's but the sheer number of Postal code calls made me realize I will run my 2400 calls per day quota in no time).
Once you Acquire the data , you can use the Code in PostalCodeBuilder.ipynb notebook to isolate the 'ontario.csv' from all of Canada which will make searches 3 times faster (and believe me you will need it !).
If you pull the whole project from github you can also find the ontario.csv included.
This is the code involved
all_postals = pd.read_table('canada.csv', sep=',')
on_postals = all_postals[all_postals['prov']=='ON']on_postals.to_csv('ontario.csv')
That is wonderful, I love this information and I appreciated this blog posting. If you have run an online business then I think this post is too much valuable your you.
ReplyDeleteUSA Dedicated Server
UK Dedicated Server
ASgAZ
ReplyDeletesgahb
ReplyDelete